Draft Greater Norwich Local Plan – Part 1 The Strategy
SECTION 2 - GREATER NORWICH SPATIAL PROFILE
Introduction
- This spatial profile outlines the main social, economic, and environmental issues in Greater Norwich which provide the context for development in the local plan.
Population
- The estimated total population[6] of the three districts in 2018 was 406,000. Of this, 55% of the population live in the Norwich urban area[7], with around 10% living in the market towns of Aylsham, Diss, Long Stratton, Harleston and Wymondham. Around 35% of the population live in smaller towns and villages.
- Parishes close to the city have a strong relationship with Norwich, while parts of the area look to the network of towns and larger villages to meet every-day needs and provide employment.
Table 1 - Population of the largest settlements in Greater Norwich, 2011[8]
|
Settlement |
Population 2011 census |
|
Norwich urban area |
213,166 |
|
Wymondham |
14,405 |
|
Diss |
7,572 |
|
Aylsham |
6,016 |
|
Hethersett |
5,691 |
|
Poringland (including Framingham Earl) |
4,826 |
|
Harleston |
4,641 |
|
Long Stratton |
4,425 |
|
Horsford |
4,163 |
|
Brundall |
4,019 |
|
Blofield |
3,316 |
|
Acle |
2,824 |
|
Reepham |
2,709 |
|
Hingham |
2,367 |
|
Loddon and Chedgrave |
2,284 |
|
Wroxham |
1,502 |
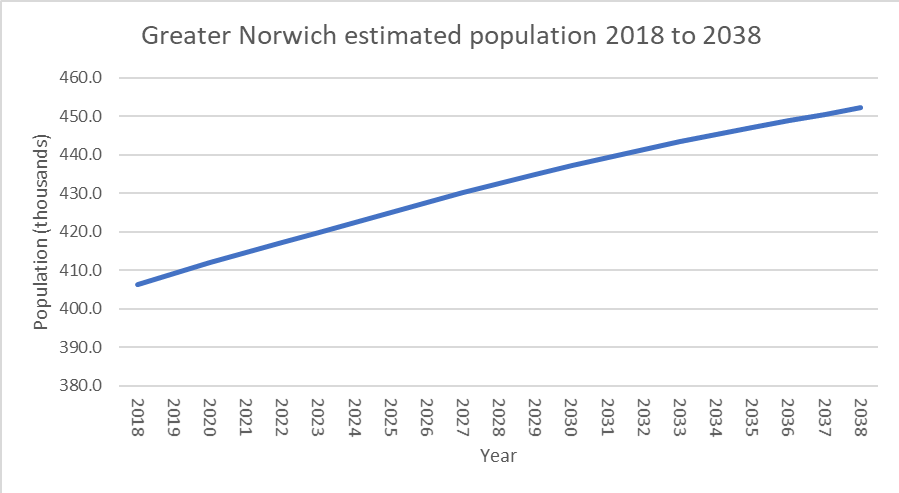
- Long term trends underpin the need for the GNLP to plan for continued population growth. The numbers of people living in Greater Norwich rose steadily from 351,000 in 2001 to 381,000 in 2011[9]. This was due to both natural increase, such as people living longer, and people moving into the area, largely from elsewhere in the UK.
- Further estimates shown in the graph below suggest that this increase will continue in the years up to 2038, rising from around 406,000 in 2018 to around 452,000 by 2038[10].
The population mix
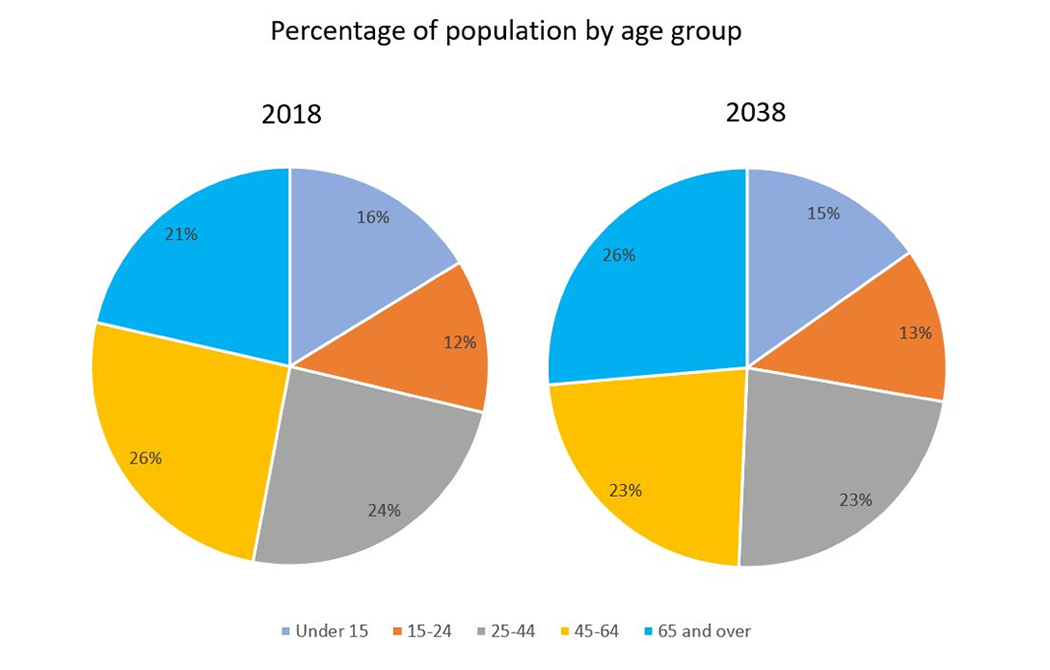
- The population of Greater Norwich has relatively high proportions of older people compared to national figures and this pattern is set to increase to 2038 as shown in the charts below[11]. Broadland and South Norfolk have proportions of older people significantly above the national average. Further growth of the older population will add to already significant pressure on residential and home care services, so it is important that the GNLP plans for changing housing needs.
- Birth rates have declined in recent years, both locally and nationally. The birth rate in Greater Norwich fell from 11.3 in 2011 to 9.6 in 2018[12] reflecting the national pattern. The birth rate in England and Wales in 2018 was the lowest ever recorded.
- However, there are higher than average proportions of young adults in Norwich and the pie charts above show that this trend is set to continue. This is largely due to the high and growing student population. Graduate retention in our area is good. But demographic changes mean more and more older people will be supported by fewer people of working age, therefore it is important that the plan helps to keep young people in our area by assisting in providing suitable jobs and housing.
- While the overall proportion of minority ethnic residents is relatively low, there was a significant increase from 1.8% in the Greater Norwich area in 2001 to 4.8% in 2011. This increase is particularly relevant to Norwich, which saw an increase from 3.2% in 2001 to 9.3% in 2011.
Health and wellbeing
- The health of people in Broadland and South Norfolk is generally better than the national average, but in Norwich it is markedly worse. There is also marked variation within the city itself with life expectancy being 10.9 years lower for men in the most deprived areas than in the least deprived[13].
- There are higher crime levels in inner urban wards, particularly in areas with a concentration of late-night drinking establishments. Overall, according to ONS data for 2019[14] , crime rates in the Norfolk police force area remain relatively low (10th out of 43 for crime rate[15]). Statistics relating to knife crime show Norfolk to be amongst the lowest in the country (9th lowest out of 43). However, Norwich experienced an increase in knife crime between 2016-18 to a rate of 10 per 10,000 people, compared to 1.1 per 10,000 in both Broadland and South Norfolk[16].
- Statistics relating to drug related crime show Norfolk to be 25th out of police 43 areas in England and Wales in 2019. Research[17] found that Norfolk is the top county affected by London individuals linked (or suspected to be linked) to County Lines, with Norwich listed as the most prominent city.
- It is important that the local plan ensures that new development is designed to minimise crime.
Housing
- This GNLP needs to plan for additional housing needs above and beyond existing commitments based on the most up-to-date evidence. Several factors are driving this increase in the need for housing including rising population levels, an increase in the number of older people and a limited supply of housing over much of the last decade.
- Across Greater Norwich there is a shortage of housing across all tenures. Overall delivery of housing from 2008-14 was at approximately 70% of the target, compared to a national delivery rate of 60%[18].
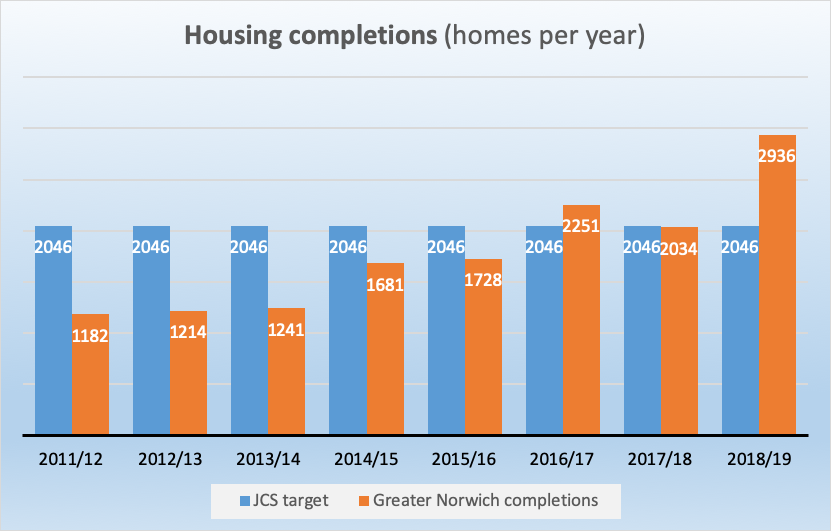
- Between adoption of the Joint Core Strategy (JCS) in 2011 and 2019, 87% of the housing target has been delivered. Whilst housing completions were well below target in the early years of the JCS plan period, there was a generally a steady annual increase in completions, and delivery was around and above the JCS annual target in the most recent years (see housing completions graph below). This increase in delivery is reflected in the fact that the Government's Housing Delivery Test in 2019 shows that Greater Norwich delivered 133% of the number of homes required between 2015/16 and 2017/18.
- In 2018 Greater Norwich had a five-year housing supply, including the 5% buffer required by the NPPF.
- Part of the reason for the increase in housing delivery in 2018/19 is that changes in Government policy have allowed new purpose-built student accommodation delivery to be included in the housing figures at a rate of 1 home per 2.5 student bedrooms. 250 new student bedrooms were delivered in 2018/19, the equivalent of 100 new homes[19]. This reflects a growing trend in recent years for new student accommodation development, particularly at the University of East Anglia (UEA) and in the city centre. As the UEA and the Norwich University of the Arts (NUA) expand further and some students seek better quality accommodation, this trend is expected to continue to 2038.
- The contribution from housing delivered through change-of-use has also increased in recent years. A significant proportion of this has been delivered through permitted development, particularly through the conversion of offices in central Norwich. It is expected that this trend is likely to diminish over time as the supply of offices suitable for conversion is used up. Broadland and South Norfolk have had very low numbers of homes delivered through change of use.
- Broadland and South Norfolk are dominated by owner-occupied housing, whilst Norwich has a much higher percentage of social rented and private rented properties (see table 2 below)[20]. The figures for owner occupation compare to a national figure of 63%. The area's tenure mix has changed since 2001, with falls in home ownership and social renting and corresponding rises in the percentage of private rented properties across all three districts, mirroring the national picture. This trend seems likely to continue.
Table 2: Tenure mix of housing in Greater Norwich districts in 2018:
|
Owner occupied |
Private rented |
Social rented |
|
|
Broadland |
79% |
12% |
9% |
|
Norwich |
39% |
30% |
31% |
|
South Norfolk |
76% |
12% |
12% |
- Housing affordability has worsened significantly in recent decades. In 2018, the property price to earnings ratio was 9.2 in Broadland, 7 in Norwich and 8.8 in South Norfolk, compared to a national average of 7.8[21]. Affordability is a major barrier to home ownership locally.
- Local evidence[22] identifies that 28% of the housing required from 2015 to 2038 should be affordable housing. It also shows that the mix of housing tenures required differs by the type of home as illustrated in the graph below. The highest requirement is for three bed homes.
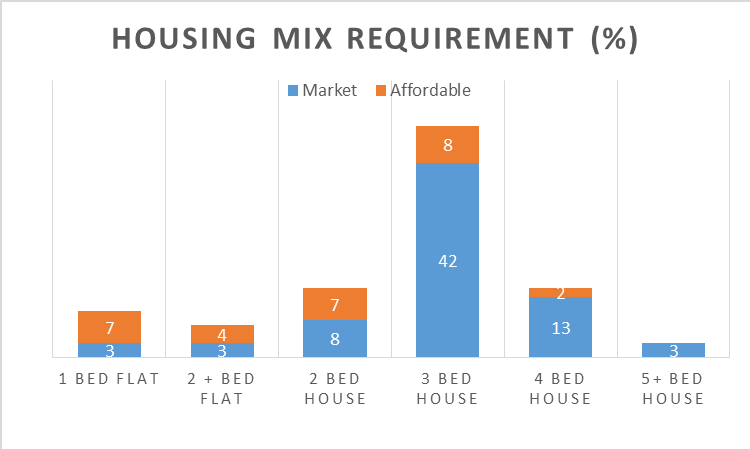
- This plan seeks to address this by developing the required number of homes to meet this demand.
- Due to the projected increase in the numbers of older people, local evidence in the Strategic Housing Market Assessment suggests that around 3,900 additional communal establishment places for over 75s will be required to 2038. The plan will need to have policies which specifically support the delivery of housing suitable for older people.
- The provision of sites for Gypsies and Travellers consisted of 84 pitches in 2017. These are on large sites at Swanton Road (Norwich), Roundwell (Costessey) and Harford Bridge (Keswick), and on several small sites around the area. There are 55 plots for travelling show people at Hooper Lane in Norwich. There will be a need for some additional accommodation during the plan period.
- There are some wards and more localised areas with high levels of deprivation in Norwich[23]. Although the surburban and rural parts of Greater Norwich are relatively affluent, there are pockets of deprivation elsewhere too. It is important that inclusive growth and regeneration is supported through the GNLP to help to reduce deprivation.
The economy
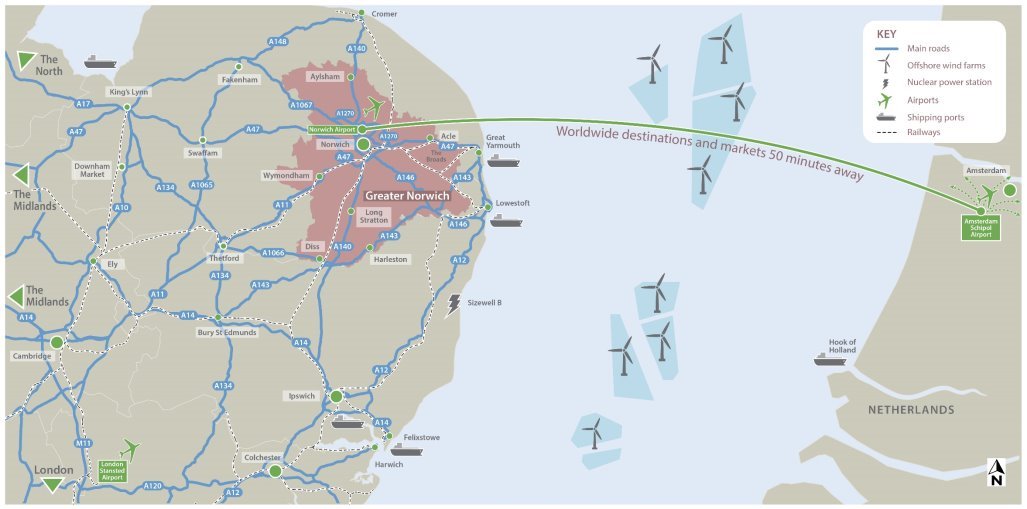
- Greater Norwich is key to the region's economy with considerable potential for growth in world class knowledge intensive jobs (as shown in map 1 on page 18[24] below). Strategic employment sites and competitive land and business lets[25], mainly those in and around the Norwich and Wymondham area, support a globally significant growth axis within the Cambridge Norwich Tech Corridor[26].
- The vibrant, attractive city centre of Norwich is a catalyst for economic growth across Greater Norwich, encouraging investment into the area. Market towns at Diss, Harleston and Aylsham and other local employment sites provide accessible employment for rural areas.
- Between 2011-18 modelling[27] shows a 14.6% rise in total employment (29,100 jobs). This included notable increases in jobs in the accommodation and food sectors, IT and communications, professional, scientific and technical professions, education and health. However, employment in agriculture, manufacturing and insurance fell.
- Greater Norwich also strongly features most of the sectors identified as having high growth potential regionally[28]. These include: advanced manufacturing and engineering at Hethel; agri-tech, health and life sciences at the Norwich Research Park (NRP) and the Food Enterprise Park; and IT and communications and digital creative industries in the city centre. Greater Norwich's other strengths include financial services, tourism, retail, media and the arts. The area also benefits from a strong and growing tertiary education sector provided by UEA, NUA, City College Norwich and Easton College which contribute research expertise and a skilled workforce.
Highlights of the Greater Norwich economy[29]
- The life-science sector has a skilled workforce of 15,000 in the Norwich cluster and the Norwich Research Park is the UK's largest site for research in food, health and life sciences;
- Agri-tech is a sector worth £3.6 billion and Easton College provides 5,000 students with training in the area which feed into the sector;
- IT and communications and digital creative industries account for a sector worth £1.4 billion with over 100 companies in Norwich and a workforce of 7,500, including large numbers of graduates from the local universities;
- The financial sector employs more than 11,500 people and contributes £1 billion to the local economy;
- Greater Norwich boasts an extensive and varied leisure and culture offer. The tourism sector is worth £3billion and the visitor economy supports 54,000 skilled workers thanks to the growing number of day visitors, currently estimated at 40 million per year, and 12 million overnight visitors. Visitor attractions include a wide variety of historic buildings, parks and museums, cultural festivals and other regular events, along with access to the Broads and the coast. Sports and leisure facilities include numerous attractive open spaces and routes for walking and cycling, a dry ski slope, the only Olympic sized swimming pool in the region, leisure centres, Norwich City Football Club, theatres, cinemas, music venues and restaurants and bars;
- Retail remains the largest provider of employment in the area. Norwich is rated as the 13th best performing retail centre nationally and our market towns also have a strong local retail offer.
- In December 2013, the Greater Norwich City Deal was signed, which is building on the area's leading status in science, technology and advanced manufacturing and focusses on enterprise, skills and infrastructure.
- Employment rates in Greater Norwich compares favourably to national trends, with rates of claimants for Jobs Seekers Allowance and Universal Credit below regional and national levels.[30]
- Rural enterprises are important to the local economy and home working is increasing in significance. The proportion of micro-businesses employing up to nine people is above the national average in Broadland and South Norfolk. Signs are that new and small businesses can flourish and the survival rate of newly established enterprises is good[31].
- The GNLP should support the growth of a wide ranging and changing economy, ranging from high tech businesses with the capacity for major growth through to smaller rural enterprises.
Map 1 The Cambridge Norwich Tech Corridor
|
|

Education and social mobility
- Whilst tertiary education plays an important role in supporting a growing economy (see paragraph 55), in more deprived parts of the area educational attainment is low. Norwich has slightly lower than the national average percentage of people educated to NVQ4 level[32] (first year of degree level) and above the Norfolk and national average level of 16-17-year olds not in education, employment or training (NEETs)[33] at 9.2%. Norwich also performs particularly poorly for social mobility[34] with an overall ranking of 294th out of 324 local authority areas in 2017.
- The picture for education and social mobility in Broadland and South Norfolk is generally better. Broadland has the lowest levels of 16-18-year olds who are NEET in the country at 3.3%, above the national average of residents educated to NVQ4 level, and higher levels of social mobility ranked at 93rd. South Norfolk has 3.9% of 16 to 18-year olds who are NEET, is ranked 152nd in the social mobility index, but has lower than national average figures for percentage of the population educated to NVQ4 level.
- The GNLP will need to plan for inclusive growth to help to address social mobility and educational attainment issues.
- As of May 2019, there are 24 secondary and 149 primary schools in Greater Norwich. The GNLP will need to make provision for additional schools and school places to serve growth.
Infrastructure
- Historically relatively poor strategic infrastructure links limited growth in the area. But recent and planned infrastructure improvements are set to assist growth (see map 2 below and the Key Diagram).
The road network
- The A11 corridor is a major focus of growth, with the route providing key strategic access to London, Cambridge and much of the rest of the UK via the M11 and A14. Dualling was completed in 2014 and the Cambridge Norwich Tech Corridor initiative aims to take advantage of this to boost economic development.
- The main east-west road link is the A47. It connects the area to Great Yarmouth and Lowestoft to the east. Both are coastal resorts and industrial towns with significant regeneration needs. The development of Eastport at Great Yarmouth provides improved access to continental Europe and for offshore industries. To the west the A47 provides access to the Midlands, the North and to growth areas locally at Dereham and King's Lynn.
Map 2 Greater Norwich main transport links
- Full dualling of the A47 route is promoted through the A47 Alliance, which brings together the business community, local authorities, MPs and stakeholders along the whole of the trunk road route between Peterborough and Lowestoft. The Government's Roads Investment Strategy has identified further improvements within the Greater Norwich area at Blofield to North Burlingham, Thickthorn, and Easton to East Tuddenham. These are scheduled to start in 2021/22, 2020/21 and 2021/22 respectively. This will benefit growth in the GNLP area by improving connectivity.
- Greater Norwich also includes two routes which form part of the Government's Major Road Network (MRN) - local non-trunk roads of national importance. Within the Greater Norwich area, this includes the A140 both north and south of Norwich (including the A1270 Broadland Northway, also known as the Norwich Northern Distributor Road) and the A146 connecting Norwich to Lowestoft. Working with Transport East, the sub-national transport body, the Long Stratton bypass has been identified as a regional MRN priority and given conditional approval for Government funding.
- To the south, the A140 provides access to Ipswich and London and to Bury St. Edmunds and Cambridge from the south of the area. It also provides local links to Diss and Harleston and is almost entirely single carriageway. To ease congestion through Long Stratton, a bypass is planned to be delivered alongside 1,800 new homes. Subject to full approval by Government, construction of the Long Stratton bypass could commence in 2022.
- The A1270 Broadland Northway was opened in 2018. It has reduced congestion through the north of Norwich and improved access to the airport, coast and Broads. Related improvements to public transport in Norwich are an integral part of the scheme. A preferred option to extend the road with a "Western Link" between the A1270 and the A47 has also been identified.
The rail network
- The main rail services to and from Norwich provide direct access to Wymondham, Ely, Cambridge, the Midlands and the North and to Diss, Ipswich and London. Improvements including faster services to London and direct services to Stansted have been delivered or are planned. The East-West rail route linking directly to major growth areas around Milton Keynes and Oxford is a long-term aspiration.
- The Bittern and Wherry Lines provide local rail links and options for commuting from areas such as Great Yarmouth, Lowestoft, Brundall, Acle, North Walsham, Cromer and Sheringham. Many of the improvements will be delivered through the new Greater Anglia franchise which started in August 2019.
Airports and ports
- Norwich Airport is a catalyst for economic growth and has seen an increase in passenger numbers in recent years. As well as the key scheduled service to Schiphol (Amsterdam) which provides a hub for links to over 1,000 international destinations, there is significant business from offshore industries and domestic flights. Other principal international connections are via Stansted Airport and ports at Felixstowe and Harwich. These ports are the gateway to exports of goods worth £2.9bn every year.
The cycle network
- Norwich is in the top five districts in the country for cycle use and recent monitoring conducted in the Norwich urban area[35] showed that there has been a 40% increase in cycling since 2013.
- There is a relatively good network of cycle routes linking settlements within Greater Norwich, including the Marriott's Way, which links the city to Reepham and Aylsham. Significant grant funding has been secured to improve the cycle network in and around the city, linking the Norwich Research Park and the city centre to the North-East Growth Triangle in Broadland, and to invest in other routes including between Wymondham, Norwich and Sprowston.
Transport for Norwich and the Transforming Cities programme
- Norwich has also been successful in securing a place in the Government 's Transforming Cities programme which has the potential to bring significant investment to the transport networks in the city and surrounding areas. £6.1 million was secured from the fund in early 2019 and bids are being made for further funding. The programme seeks to promote modal shift away from use of the private car in a time of rapidly changing vehicle technologies. Evidence of such a shift was already seen after First Eastern Counties reported a 375,000 increase in Norwich bus journeys in 2015 following the completion of Transport for Norwich changes to improve accessibility to the city centre for buses.
- The Transport for Norwich review will guide future transport policy and investment in and around the city. The network will continue to be developed to promote public transport use in growth areas such as Wymondham, the airport and Broadland Business Park. This will include the Park-and Ride network around Norwich which, with 6 sites, forms one of the most comprehensive networks in the country and is well-connected to other bus routes.
- Transport improvements outside of the Transport for Norwich area are dealt with on a local basis. For example, Norfolk County Council has commenced a programme of Market Town Network Improvement Strategies (NIS). The Connecting Norfolk initiative also promotes increasing use of demand responsive transport services and car sharing in rural areas.
Digital infrastructure
- There is variable access to high speed broadband and mobile phone connectivity can be poor, particularly in rural areas. To help address this, the Better Broadband for Norfolk programme is a partnership funded through Norfolk County Council. It aims to make high-speed broadband available to more than 95% of Norfolk's premises by spring 2020. The next generation of mobile phone networks will be 5G, and the rollout is expected to commence in 2020.
Emissions and climate change
- Mitigating the effects of climate change within the Greater Norwich area is a cornerstone of the GNLP. This section looks at current activity around measuring air quality as well as future trends in emissions, rainfall and flooding levels.
- There is an Air Quality Management Area (AQMA) which covers the whole of the city centre. Improvements in air quality are being achieved by promoting public transport use and other initiatives, including encouraging active travel (walking and cycling). However, this remains an important issue with more work to be done.
- Per capita carbon dioxide (CO2) emissions, at 5.1 tonnes CO2 equivalent per year, are below the national average (5.3 tonnes CO2 equivalent). In recent years, they have declined in line with regional trends and slightly slower than national trends[36]. However, they are above the national average in rural parts of the area, partly due to a greater reliance on car journeys.
- Research by the world-leading UEA[37] shows how our climate will change in the East of England up to 2040 with higher temperatures, less rain in summer and wetter winters. It indicates:
- An increase in mean summer temperature of 1.2°C to 1.6°C
- An increase in mean winter temperature of 1.0°C to 1.3°C
- A decrease in mean summer precipitation of 1% to 13%
- An increase in mean winter precipitation of 5% to 8%.
- Policies in the GNLP will need to contribute to national targets to reduce emissions, plan for transition to a post-carbon economy and ensure new development is adapted to a changed climate.
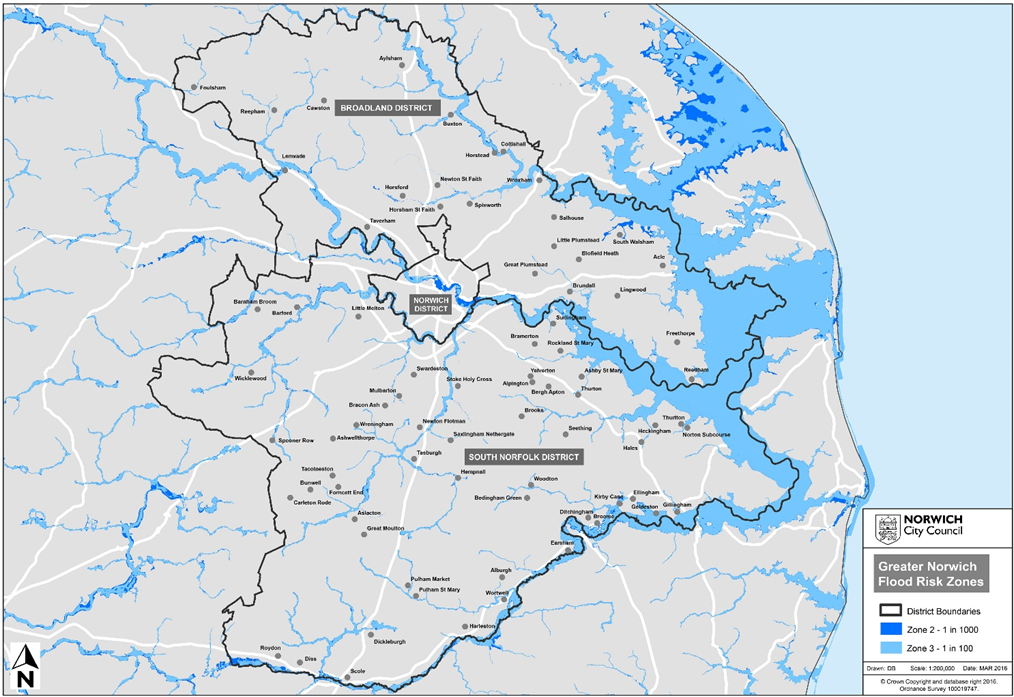
- The main inhabited area at risk of fluvial (river) flooding in Greater Norwich is in the Wensum valley covering parts of central Norwich (see map 3 below).
- There are small scale flood defences across Greater Norwich with more extensive defences by the River Wensum within The Close area of central Norwich and on the River Bure at Buxton. There are also flood defences within the neighbouring Broads Authority planning area, with an extensive programme of improvements being implemented within the Broads[38].
- Whilst the great majority of development in recent years has been away from areas of flood risk from rivers, recent development on brownfield sites to provide urban regeneration adjacent to the River Wensum in Norwich has been designed to withstand flood.
- Measures to address surface water flood risk in areas at the greatest risk, including parts of Norwich and Drayton, have included maintenance of drainage systems, the introduction of detailed development management policies covering such areas and funding bids for mitigation works.
- This plan will need to provide strategic level policies to address flood risk in new development, locating development the great majority of development away from areas at risk of flood.
Map 3 Environment Agency fluvial flood risk zones 2 and 3
Renewable Energy
- Recent years have seen an increase in renewable energy generation locally, chiefly from solar power (both small and large-scale), with some wind and biomass developments. Our plan should support further development of decentralised, renewable and low carbon sources of energy.
Environmental assets
The built and historic environment
- Greater Norwich has a rich concentration of historic assets. At its core is the City of Norwich, formerly England's second city, with its two cathedrals and many other historic buildings, including the greatest number of medieval churches in northern Europe, monastic halls, former merchants' houses, the city wall and industrial heritage.
- The city is linked to a hinterland of settlements which also have a rich heritage reflecting the area's relative prosperity and high density of settlement through history, particularly prior to the industrial revolution.
- Market towns, villages and hamlets show a pattern of development that has built up over the centuries, with a wealth of medieval churches, including a number of round tower churches, farmsteads and historic halls. A number of areas of formal parkland, such as those at Raveningham and Blickling Halls, are designated by Historic England.
- In total, there are around 5,800 listed buildings and 90 conservation areas. Ancient monuments and significant archaeological potential add a further layer to this historic character.
Table 3 – Numbers of Conservation Areas, Listed Buildings, Ancient Monuments and Historic Parks
|
Feature |
Norwich |
Broadland |
South Norfolk |
Greater Norwich |
|
Conservation Areas |
17 |
21 |
52 |
90 |
|
Listed Buildings |
1,500 |
980 |
3,310 |
5,790 |
|
Ancient Monuments |
25 |
22 |
38 |
85 |
|
Historic Parks & Gardens (Historic England) |
9 |
5 |
7 |
21 |
|
Historic Parks & Gardens (locally listed) |
10 |
18 |
17 |
45 |
The natural environment
- Greater Norwich has and neighbours a wealth of natural environmental assets designated for both habitat and species protection. Many of these are marshland, rivers or broads of international and national status classified as Special Areas of Conservation (SACs), Special Protection Areas (SPAs) and Ramsar sites for wetland importance. The internationally protected "Natura 2000" sites subject to the Habitats Regulations in the Broads and elsewhere in Norfolk, including on the coast, could potentially be affected by growth in Greater Norwich (see map 4 below).
- Water quality is a major issue for the sensitive wetland habitats and dealing with pollution brings particular challenges. Increased pressure from housing growth within Greater Norwich combined with an increase in already high visitor numbers may also have potentially negative impacts on some sites. The GNLP must ensure that development does not have a negative impact on internationally designated sites.
- SACs in Greater Norwich itself include the Wensum chalk river valley and valleys and fens at Booton Common and Buxton Heath. There are also 45 nationally important Sites of Special Scientific Interest (SSSIs) designated for their biodiversity and geodiversity value. Pinebanks Pits in Thorpe St Andrew and Catton Chalk Pits are examples of sites designated for their geodiversity value.
- In addition, Greater Norwich has large numbers of locally protected sites. There were 447 County Wildlife Sites covering around 4,700 hectares of land in 2018. Sites include valleys, meadows and wetlands, such as parts of the Bure, Waveney and Yare valleys, heaths such as Mousehold, grasslands including commons such as those at Hapton, Mulbarton and Salle, and an extensive network of hedgerows and woodlands spread across the area.
Map 4 - Major Habitat Sites in Norfolk

Table 4 - Numbers of and internationally, nationally and locally designated nature conservation sites, 2015[39]
|
Feature |
Greater Norwich |
|
Special Areas of Conservation |
3 |
|
Special Protection Areas |
2 |
|
Ramsar Sites |
2 |
|
Sites of Special Scientific Interest |
45 |
|
National Nature Reserves |
2 |
|
Local Nature Reserves |
18 |
|
Roadside Nature Reserves |
52 |
|
County Wildlife Sites |
428 |
- Long-term work is ongoing to improve and expand the green infrastructure network throughout Greater Norwich and beyond. As our area is located adjacent to the Broads and other areas of national and international importance, the aim is to provide sufficient high quality green spaces to provide biodiversity buffer zones, promote active leisure and travel and provide alternative destinations to help manage visitor pressure on biodiversity.
- Parks and other types of open space also play an important role in providing a network of locally accessible green and urban spaces.
Landscape
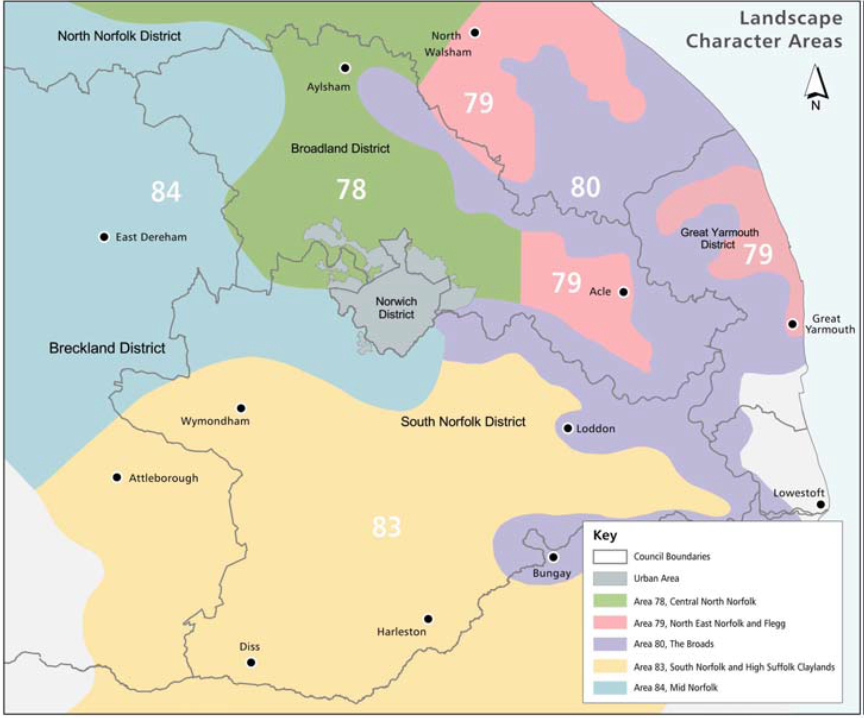
- The varied landscape character areas[40] in and adjacent to Greater Norwich area consist of: the fens and marshes of the Broads to the east of Greater Norwich (area 80 on map 5 below); a more intimate landscape of small fields and hedgerows adjacent to the Broads, also in the east (area 79); rolling landscapes of varied geology including woodland, heath and former parkland estates in the west and north (areas 84 and 78) and an extensive open clay plateau in the south (area 83).
- These nationally identified landscape charcter areas inform local landscape character studies. Greater Norwich does not have a nationally designated Green Belt. National policy is clear that new Green Belts should very rarely be established. Therefore this plan will need to carry forward policies for protecting our valued landscapes
Map 5 - Natural England Landscape Character Areas
Soils
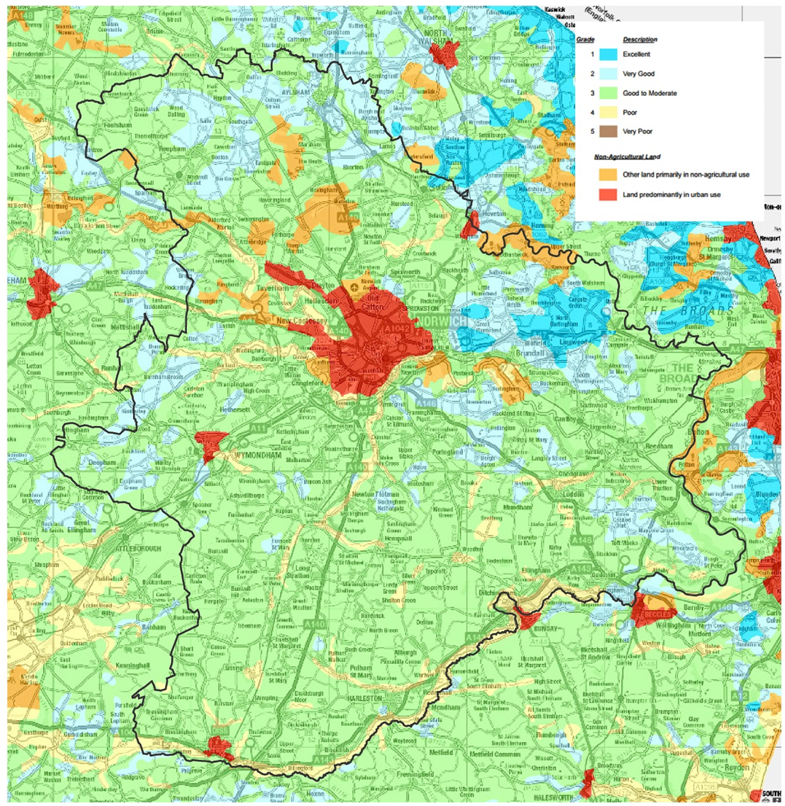
- Large tracts of rural Greater Norwich are valuable for their agricultural land. As map 6 below shows, a high proportion of Greater Norwich's agricultural land is of high quality (grades 1-3), with the majority of the most valuable land being located between Norwich and Acle[41] . Protecting high quality soils remains important both for supporting agriculture and shaping our rural landscape character.
Map 6 - Agricultural land grading in Greater Norwich
Water
- Water is supplied in Greater Norwich from groundwater sources and from the River Wensum.
- Relatively low rainfall totals and extensive agricultural water use demand mean that the whole area is defined as suffering from serious water stress[42]. Local planning policy and water company strategy[43] place a focus on promoting water efficiency.
[7] The Norwich urban area is Norwich and the built up parts of the fringe parishes of Colney, Costessey, Cringleford, Drayton, Easton, Hellesdon, Old Catton, Sprowston, Taverham, Thorpe St. Andrew, Trowse and the remainder of the Growth Triangle.
[8] ONS census 2011 from https://www.nomisweb.co.uk/reports/localarea
[9] Census data as above
[11] Source ONS 2016 projections as above
[14]https://www.ons.gov.uk/peoplepopulationandcommunity/crimeandjustice/datasets/policeforceareadatatables
[15] Official UK Crime Rate (CR) statistic, CR is best understood in totality as "Crimes per 1,000 resident people as per the latest official Census over a selected time period"
[16] Norwich: https://ukcrimestats.com/Subdivisions/DIS/6759/
Broadland: https://ukcrimestats.com/Subdivisions/DIS/6553/
South Norfolk: https://ukcrimestats.com/Subdivisions/DIS/6724/
[17] The research was carried out by the Mayor of London and published in the document: "Rescue and Response County Lines Project – Supporting young Londoners affected by county lines exploitation – Strategic Assessment (August) 2019 "
[19] Source: Data from forthcoming Greater Norwich Annual Monitoring Report 2018/19
[20] Source: Office for National Statistics
[21] Source: Office for National Statistics
[24] Source: Invest in Greater Norwich
[25] Source as above – On average, business lets are 45% cheaper in Greater Norwich than in London or Cambridge
[27] Source: Cambridge Econometrics: 'East of England Forecasting Model: 2016 baseline results'
[28] Sectors identified in the New Anglia Local Enterprise Partnership's Economic Strategy for Norfolk and Suffolk.
[29] Source: Invest in Greater Norwich
[32] Source: Nomis Norwich has 38.5% of its population educated to NVQ4 level and above, Broadland 39.7% and South Norfolk 36.9%. The Great Britain figure is 39.3%.
[33] Source: Government NEET statistics
[35] Source: Norfolk County Council / Norwich City Council
[36] Source: Department for Business, Energy and Industrial Strategy Between 2005 and 2017, Greater Norwich emissions fell by 35%, East of England emissions by 35% and UK emissions by 39%.
[37] Source: Scoping Report for the New Anglia LEP Climate Change and Adaptation and Carbon Reduction Action Plan (July 2019)
[38] Source: Greater Norwich Area Strategic Flood Risk Assessment
[39] Sources: Norfolk Biodiversity Information Service and Natural England. Some sites have several designations, so are counted more than once in the table.
[41] Note: The map is indicative as it does not break down category 3 into a and b classes
[43] Anglian Water - Anglian Water Revised Draft Water Resources Management Plan 2019